Information Categorization Method
Introduction
Everyday life is full of information, ranging from items in newspapers or televised reports, to highway signs, to works of music and literature. A common underlying feature of the many different types of information-carrying entities is that they can be coded and broadcast by a sequence of symbols. Some of these sequences are uniquely human creations, such as language, both spoken and written, and music. Other information sequences are generated by natural processes, such as genetic codes and the electrical transmission signals of our nervous systems.
The central problem in the analysis of these complex sequences is how to effectively categorize their origins based on their information content. For example, musical compositions by different composers usually display differentiable styles that can be recognized by experienced listeners. Unfortunately, this type of categorization that is processed by complex cognitive processes is not yet quantifiable.
The central problem in the analysis of these complex sequences is how to effectively categorize their origins based on their information content. For example, musical compositions by different composers usually display differentiable styles that can be recognized by experienced listeners. Unfortunately, this type of categorization that is processed by complex cognitive processes is not yet quantifiable.
Algorithm
In order to develop an effective algorithm to solve this challenge, it is useful to begin with perhaps the most fundamental, common feature of information-carrying sequences, namely, that the information is encoded by a finite number of repetitive elements. This property is immediately apparent for all written and spoken human languages, in which the repetitive elements are words. Furthermore, other forms of “words” or their equivalents can also encode different types of information. For example, the genetic sequences of the millions of species on the earth are simply based on the arrangements of four basic molecules, called nucleotides, abbreviated as A, G, C, and T.
This common feature supports the intuition that the composition of “words” is closely related to the information carried by the sequence itself. Therefore, information categorization is developed to classify symbolic sequences by comparing word compositions. Our approach is based on word rank-order frequency statistics.
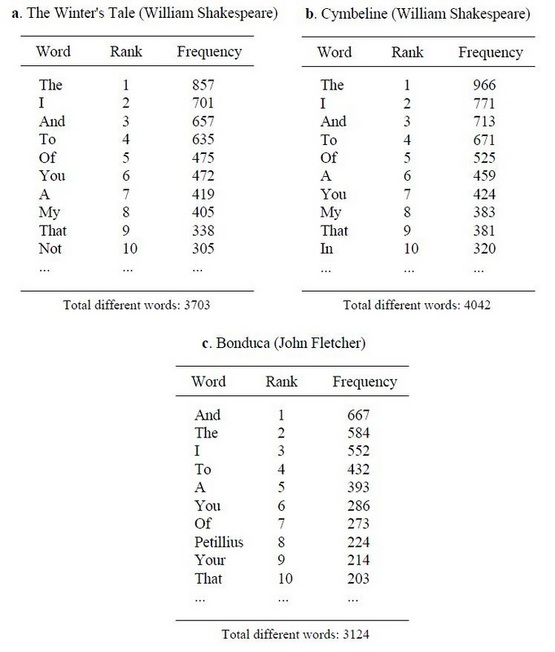
To visually illustrate our word rank order and frequency algorithm for measuring the distance between texts, we start with an example, selecting two of Shakespeare’s plays, Cymbeline (1609) and The Winter's Tale (1610), as well as one of John Fletcher’s plays, Bonduca (1611). The first step is to construct a word frequency list by counting the occurrence of each word in a text, and ranking them by descending frequency (most frequent to least frequent).
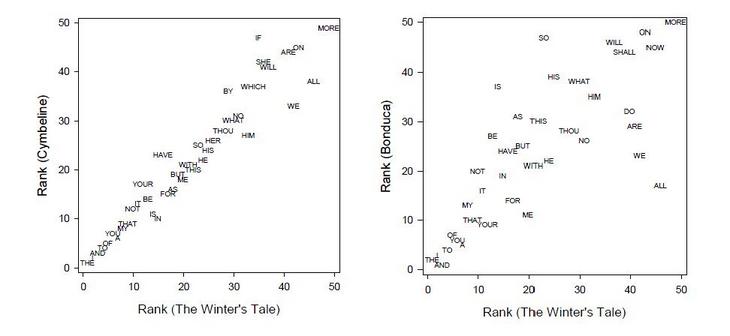
Next, we identify those words that are shared by the two texts. The rank order differences between two texts can then be visualized by plotting the rank number of each shared word in the first text against that of the second text. For example, the word “me” is the 20th most frequently used word in The Winter's Tale, but the 11th most frequently used word in the play Bonduca. Therefore, the word “me” is placed at a location with horizontal coordinate of 20 and vertical coordinate of 11. If the rank-frequency statistics of two texts are identical, the shared words will fall along the diagonal line connecting the lower left and upper right parts of the graph.
The above shows the comparison between the two Shakespeare plays and one play by John Fletcher. The words are tightly centered along the diagonal line, indicating the rank of each word is very similar in these two plays. In contrast, when the same comparison is made between the plays attributed to Shakespeare and the Fletcher play, respectively, the words are more widely scattered around the diagonal “line of identity.” As demonstrated by the above examples, the “distance” (or dissimilarity) between any two texts can be quantified by measuring the scatter of these points from the diagonal line in this rank comparison plot. Greater distance indicates less similarity and vice versa. Based on this information categorization approach, we have developed a quantitative index to measure the dissimilarity between symbolic sequences.
Applications and Tools
We have demonstrated the applicability of this method to heart rate dynamics, genetic sequences, and historic authorship questions related to the classic Chinese novel “The Dream of the Red Chamber,” to the plays of William Shakespeare, and to the Federalist Papers.
A Matlab toolbox is publicly available at Matlab Central for applications to heart rate dynamics, written texts, genetic sequences or other symbolic sequences.
This toolbox provides an array of MATLAB functions for quantifying the distance (or dis-similarity) between a set of symbolic sequences, and for displaying the results in graphical form such as dendrogram. The type of symbolic sequences can be binary sequences mapping from a time series, written texts of any given language, genetic sequences, or virtually any type of signals.
A publicly available software for measuring distance among interbeat interval time series is on Physionet
Presentation
References
1. Yang AC, Hseu SS, Yien HW, Goldberger AL, Peng CK. Linguistic analysis of human heartbeats using frequency and rank order statistics. Phys. Rev. Lett. 90, 108103 (2003). [ PDF ]
2. Yang AC, Peng CK, Yien HW, Goldberger AL. Information categorization approach to literary authorship disputes. Physica A, 329, 473 (2003). [ PDF ]
3. Yang AC, Goldberger AL, Peng CK. Genomic classification using an information-based similarity index : application to the SARS coronavirus. J Comput Biol. 12(8):1103-16 (2005). [ PDF ]
4. Peng CK, Yang AC, Goldberger AL. Statistical physics approach to categorize biologic signals: from heart rate dynamics to DNA sequences. Chaos 17: 015115 (2007). [ PDF ]
5. Yang AC, Peng CK, Goldberger AL. The Calvin & Rose G Hoffman Marlowe Memorial Trust 2003 Prize, “The Marlowe-Shakespeare authorship debate: approaching an old problem with new methods.” [ PDF ]
6. Yang AC, Tsai SJ, Hong CJ, Wang C, Chen TJ, Liou YJ, Peng CK. Clustering heart rate dynamics is associated with β-adrenergic receptor polymorphisms: analysis by information-based similarity index . PLoS ONE 6(5): e19232 (2011). [ PDF ]
Your comments and suggestions are welcome.
Please send your comments by email to Dr. Albert C. Yang (Laboratory of Precision Psychiatry).
Location: No. 155, Section 2, Linong Street, Beitou District, Taipei, Taiwan
Please send your comments by email to Dr. Albert C. Yang (Laboratory of Precision Psychiatry).
Location: No. 155, Section 2, Linong Street, Beitou District, Taipei, Taiwan


